• Sign In/Sign On
    • Register
    • Log In
    • Heights Observer main site login
  • Rules/FAQ
  • Heights Observer
  • About
  • Skip to primary navigation
  • Skip to main content
  • Skip to primary sidebar
  • Skip to footer

Heights Observer Blog

A community blog about life in the Heights

  • HOME
  • BLOGGERS
    • Emily E. Brock
    • Robert Brown
    • Patti Carlyle
    • Andrea Davis
    • Adam Dew
    • Deanna Bremer Fisher
    • Mike Gaynier
    • Tiffany Laufer
    • Anne McFarland
    • Fran Mentch
    • Jewel Moulthrop
    • David Perelman-Hall
    • Jan Resseger
    • Bob Rosenbaum
    • Kim Sergio Inglis
    • Jim Simler on Film
    • Richard Stewart
    • Allen Wilkinson
    • GUEST BLOGGERS
  • Quality of Life
    • Arts and Entertainment
    • People/Personalities
    • Shop Local
    • Things to do
  • Multimedia
    • Photo Blog
    • Video Blog
    • Podcast
  • Government
    • Schools
      • CH-UH School Facilities Conversation at The Civic Commons
    • Development
    • Public Safety
      • Citizens Police Academy
  • Cle Hts
  • U Hts
  • Regional
  • Show Search
Hide Search

Crime trends downward in Cleveland Heights

Bob Rosenbaum · June 8, 2015 · Leave a Comment

Here is a series of charts using crime data from the Cleveland Heights Police Department. All of these have been published previously in the Heights Observer. I’m providing them as a quick visual to see crime trends. For information on how the data are gathered and managed, read the original article in the Heights Observer series, Understanding Crime in Cleveland Heights, which went online Jan. 3, 2015.

Overall crime trend

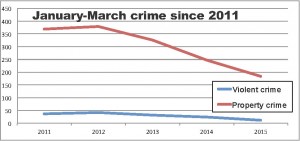
This first chart shows the downward trend in overall crime since 2011. The red line is property crime and the blue line is violent crime. The data represents the

Trend in serious crimes committed in Cleveland Heights, Full-year / 2011-2015. Copyright Heights Observer 2015. Data from CHPD.

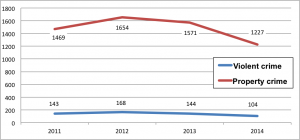
full 12 months of each year, and shows a significant delcline in both categories. The numbers don’t reflect every call that comes into the police department, nor do they include minor crimes like trespassing, disturbing the peace or driving under the influence. The FBI – which provides the recommended methodology for collecting police data – deems such “Part II” crimes as too numerous for police departments to track with such detail.

Violent crime in Cleveland Heights, 2011-2014. Copyright Heights Observer 2015. Data from CHPD.

Rather, these charts represent “Part I” crimes – serious crimes that are defined by correlating FBI guidelines with criminal codes that vary state by state. Just the process of defining crimes can be complicated and time-consuming. The beginning date for this crime data is 2011 because that’s when the CHPD implemented a new process to collect, categorize and report crime data. The goal of this process, according to Police Chief Jeffrey Robertson is consistency and accuracy, allowing effective management of department resources.

Property crime in Cleveland Heights, 2011-2014. Copyright Heights Observer 2015. Data from CHPD.

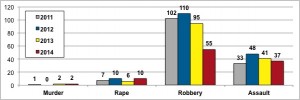
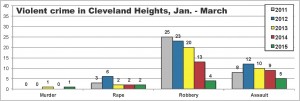
The second chart provides full-year comparisons of violent crimes since 2011, broken down by category. The total number of crimes in each year on this chart corresponds with the blue line in the chart above.

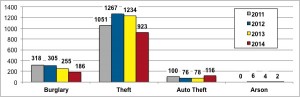
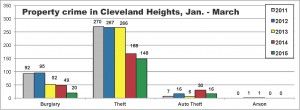
The third chart shows the full year’s worth of property crimes in each year since 2011, again broken down by category. The total for each year on this chart corresponds with the red line above.

Clearing crimes off the books

The same FBI methodology for reporting crime also covers “crime clearance rates” – how effectively police departments get crimes off the books. To qualify as

Percentage of crimes cleared (resulting in arrest/prosecution) in Cleveland Heights, 2011-2014. Copyright Heights Observer 2015. Data from CHPD.

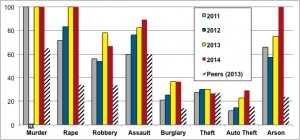
“cleared,” a crime must be solved with one or more people arrested, charged and delivered for prosecution. In certain instances when a suspect has been identified but cannot be arrested (for example, the suspect has died), the crime is also considered cleared. While lower numbers are better in the previous charts, a higher crime clearance rate is better. A clearance rate of 90% means nine out of 10 crimes in a given category have been solved and turned over for prosecution. Each shaded bar represents the CHPD’s clearance rate in a specific crime category for a specific year. The striped bar is the average clearance rate of “peer agencies” – police departments in cities wth a population of 25,000-49,999. (The 2013 population of Cleveland Heights, according to the U.S. Census, is 45,394.) The peer comparison is provided by the FBI.

How 2015 looks so far

The next three charts are crime data reported in the same format as the year-end data above, but represent data only from January through March – the first three months of each year. The first quarter of the year tends to be the quietest part of the year, according to Robertson. But year-on year, the trend continues downward.

Trend in serious crimes committed in Cleveland Heights, January - March 2011-2015. Copyright Heights Observer 2015. Data from CHPD.
Trend in serious crimes committed in Cleveland Heights, January – March 2011-2015. Copyright Heights Observer 2015. Data from CHPD.

What it means

The full-year data indicate crime in 2014 was down 26.9% from the peak year of 2012, and 17.4% from 2011 when the current reporting system was implemented. Violent crime was down 38.1% from the 2012 peak and property crime was down 25.8%.

The trend is continuing so far in 2015, with crime down 27.6% in the first three months compared to the same period last year, and 53.3% from the first three months of 2012. Violent crime was down 50.0% from the same period last year, and 70.7% from the 2012 peak. Property crime was down 25.5% from the same period last year, and 51.4% from the 2012 peak.

Violent crime in Cleveland Heights, January - March 2011-2015. Copyright Heights Observer 2015. Data from CHPD.
Violent crime in Cleveland Heights, January – March 2011-2015. Copyright Heights Observer 2015. Data from CHPD.


Property crime in Cleveland Heights, January - March 2011-2015. Copyright Heights Observer 2015. Data from CHPD.
Property crime in Cleveland Heights, January – March 2011-2015. Copyright Heights Observer 2015. Data from CHPD.
facebookShare on Facebook
TwitterTweet
FollowFollow us

Filed Under: Bob Rosenbaum, Cleveland Heights, Government, Public Safety

Reader Interactions

Leave a Reply Cancel reply

Your email address will not be published. Required fields are marked *

Primary Sidebar

Assignment: Life in the Heights

This community blog site is part of the Heights Observer community-building project in Cleveland Heights and University Heights. Anyone with a stake in the community is invited to contribute relevant content.

The Heights Observer is published by non-profit FutureHeights. Opinions expressed here are solely those of each author and do not reflect the position of the publisher.

Contact the webmaster to post a blog.

Register or login to comment. To maintain civility and accountability, register with your real name – first and last. Anonymous contributions will be deleted.

See Rules/FAQs for more detail.

NOTE: This blog site operates on a different platform than the Heights Observer’s main website and requires a separate login.

Please follow us and share

RSS
Follow by Email
Facebook
Facebook
fb-share-icon
Twitter
Visit Us
Follow Me
Post on X

Categories

Keyword search

Footer

Please follow us and share

RSS
Follow by Email
Facebook
Facebook
fb-share-icon
Twitter
Visit Us
Follow Me
Post on X

This website is part of the Heights Observer, a volunteer-based hyper-local community news project of non-profit FutureHeights.

excellence awards 20
Excellence in Journalism 2019

Copyright © 2025 · Daily Dish Pro on Genesis Framework · WordPress · Log in