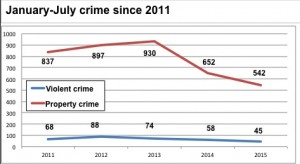
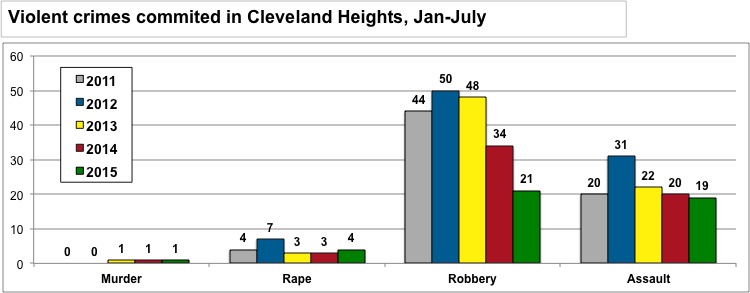
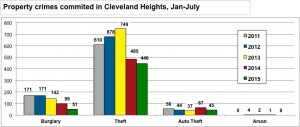
Crime data from the Cleveland Heights Police Department for the first seven months of 2015 indicate a positive trend is continuing, as year-to-year crime rates declined in all but two categories.

The only categories that didn’t show a decrease in the number of crimes were murder and rape. Through July of this year, there has been one murder in the city—the same as last year during the same period. Four rapes were reported through July, compared with three the previous year.

I’m not using percentages in reporting the data because the absolute numbers are so small in many categories that a single instance of a particular type of crime results in a large and potentially misleading percentage change.

The information is compiled by the CHPD according to federal standards defined by the FBI’s Uniform Crime Reporting system, and is published in different format on the Cleveland Heights city website. It represents serious offenses defined as “Part I” crimes. It does not include “Part II” minor offenses, such as trespassing or DUI—which the FBI does not seek from local agencies because it would be too costly to report with the same level of detail.
This information has been published in the Heights Observer as part of an ongoing series to bring transparency and understanding about public safety and crime in Cleveland Heights.
- For more information about how the CHPD collects and validates crime statistics, and why the Observer publishes them regularly, see the original article in this series, which went online Jan. 3, 2015.
- To see the information as presented on the city’s website, click here.
- To see everything on this website about this topic, click here.


Rather remarkable improvements, especially considering CH’s acknowledgement of under-reporting of crimes in prior years.
You would think the city would be boasting of these dramatic reductions in crime, which make our city so much safer and appealing.
Your top graph shouldn’t be lines, as the discreet data points represent 7 month results, not monthly trends, which is what the x-axis implies.
Just points, or bars, like the other charts, representing the cumulative 7 months of activity for each year reported.
The historical data from City-data.com showed a 300% increase in the crime index from 2001 to 2012, so this is a very welcome development and hopefully a trend that we can credit to our public safety forces and the cooperation of citizens. Perhaps the reason is as simple as the worst of the thugs and repeat offenders have been arrested and incarcerated. I think it is important to know, according to officials , why the turnaround and/or how this has been accomplished,
As explained in the original article in this series and referenced in the article above (http://www.heightsobserver.org/read/2015/01/03/understanding-crime-in-cleveland-heights-first-in-a-series), the city’s long-time police chief retired at the end of 2011 and a new chief took over.
One of the first things the new chief did was to implement a rigorous process for classifying and recording this crime data. He has stated that his reason for doing so was to be able to better manage police resources. With reliable data, you know where crimes are being committed and can do a better job making sure officers are working on the right things and are in the right places.
Prior to that, data was not used as a crime-fighting tool. It was reported grudgingly because city council demanded it – which implies a motive to report data in a way that understates the actual amount of crime.
The single largest jump in reported crime in Cleveland Heights was from 2010-2012 – when the new process was implemented.
The bottom line is that I would recommend viewing any numbers before 2011 with skepticism. I don’t believe the numbers are based on any reality, and I don’t know if the method used to arrive at those numbers was consistent from one year to the next.
But from what I have learned in my work to understand policing in the city, there is a high level of consistency in reporting those numbers since 2011. The way the information is put into the system, then reviewed and understood involves care, attention to detail and repeatability.
So I don’t believe there was actually a 300% crime increase during the period you cite. I believe there was a 300% increase in the number of crimes reported, and I believe most of that was due to the change at the beginning of 2011 – from not caring to getting very serious about having good data.
If you look at the data since 2011, you can see it took a year for other reforms in the police department to yield results; that’s why there’s an increase in reported crime from 2011 to 2012. Since then, it has been declining steadily.
Also, a word about the crime stats CIty-data.com uses: They are reported voluntarily by each municipality and collection methods are wildly inconsistent from one department to the next.
The Cleveland Heights Police Department in only the last few years has been held as an example for high-quality methods for processing crime data.
So the biggest crimes were the great risk Chief Lentz intentionally put every citizen into by his manipulation of public crime and safety information – for decades.
And that the city council never did anything about his insubordination it – for decades.
And that all the police department employees honored the Blue Code of Silence – for decades.
You have to wonder what else he did with impunity that Chief Roberts hasn’t fixed yet.
Like, say, the video cameras at the city jail, where a female was recently found neglected and dead.